User-provided fresh run with five policies (lmetric, load_only, sticky,
unified, plus a new unified_v2 variant). Reproduces the v1 set under
figs/v2/ so we can A/B the same panels:
f4a_apc_loss.png — APC bars per policy
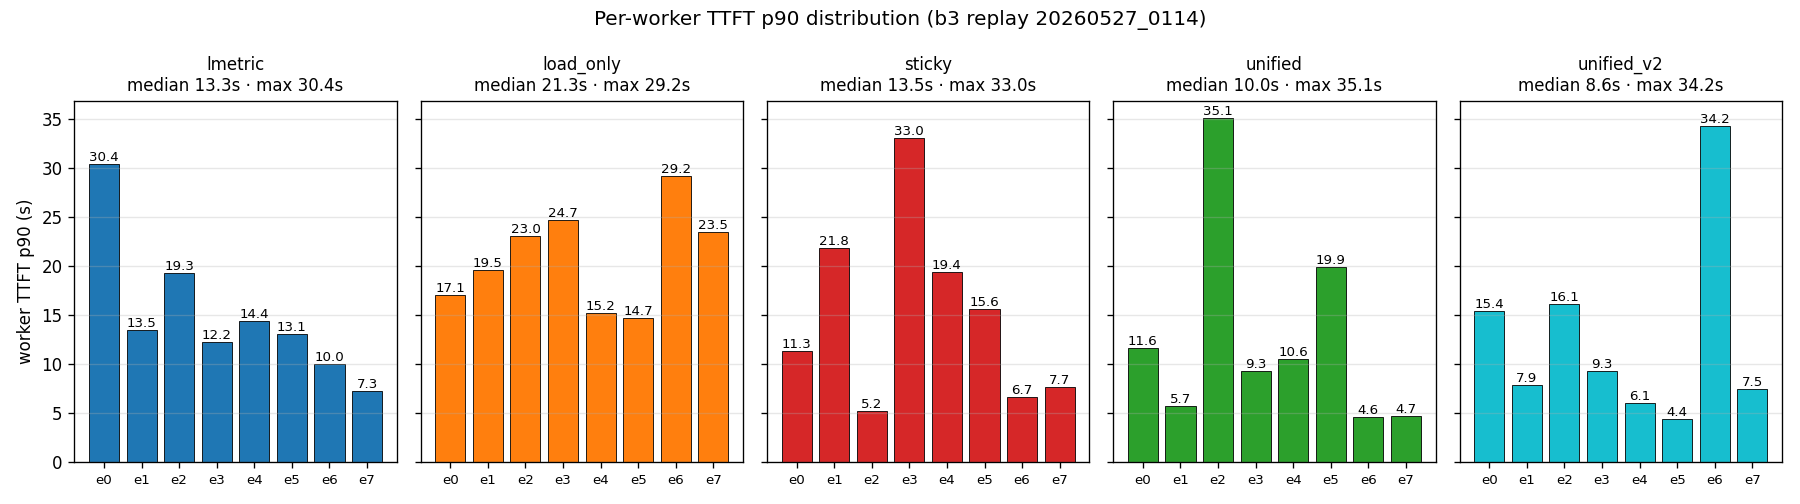
f4c_per_worker_ttft.png — per-worker TTFT p90 panel per policy
f6_e2e_latency_bars.png — TTFT/TPOT/E2E p90 bars per policy
f6_e2e_latency_full_grid — mean/p50/p90/p99 × TTFT/TPOT/E2E grid
scripts/render_b3_figures_v2.py is a standalone driver that reads each
policy's metrics.summary.json and breakdown.json directly from the run
directory — the breakdown.json `routed_to` field is required to recover
per-worker assignment because the new setup routes every request
through a proxy (127.0.0.1:9300), so metrics.jsonl's endpoint_url no
longer identifies the backend.
Headline numbers, new vs v1:
APC v2: lmetric 57.2% / load_only 53.9% / sticky 77.7%
unified 78.7% / unified_v2 78.4%
v1: lmetric 56.9% / load_only 54.1% / sticky 77.2% / unified 79.4%
TTFT p90 (s) v2: lmetric 14.8 / load_only 20.1 / sticky 14.8 /
unified 8.8 / unified_v2 10.1
v1: lmetric 15.7 / load_only 20.2 / sticky 18.0 / unified 7.3
E2E p90 (s) v2: lmetric 25.4 / load_only 33.9 / sticky 30.3 /
unified 20.0 / unified_v2 24.1
v1: lmetric 24.8 / load_only 33.5 / sticky 34.6 / unified 18.0
Worker p90 (s, median / max)
v2: lmetric 13.3/30.4 · load_only 21.3/29.2 · sticky 13.5/33.0
unified 10.0/35.1 · unified_v2 8.6/34.2
v1: lmetric 13.9/31.3 · load_only 19.4/25.1 · sticky 20.3/55.4
unified 10.3/37.7
Story is unchanged: unified dominates at p90 across TTFT/E2E and on
median-worker latency; unified_v2 is competitive at p50 but slightly
worse than unified at p90.
Co-Authored-By: Claude Opus 4.7 <noreply@anthropic.com>
65 KiB
1800x504px
65 KiB
1800x504px