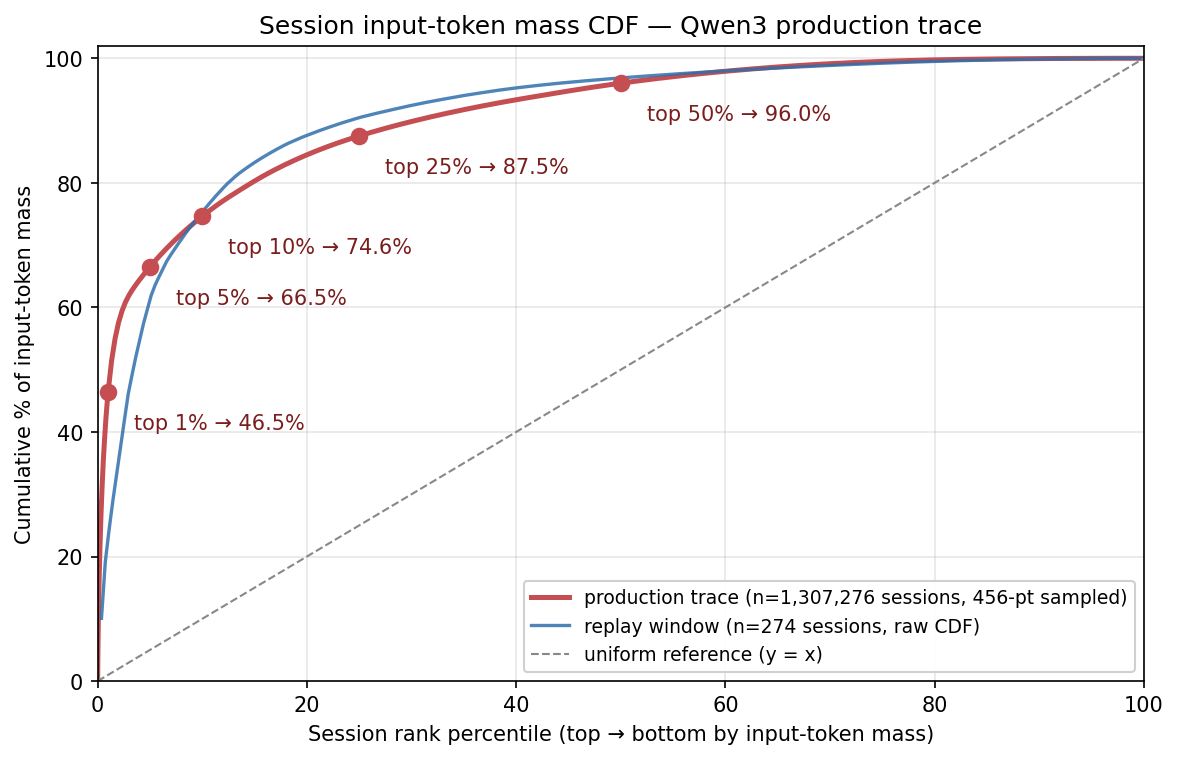
Pulls 456 (rank%, cum%) sample points from the raw production trace at
dash0:/home/admin/cpfs/wjh/ali-trace/trace-glm5.1-formatted/051315-051317.jsonl,
cached locally so the figure is reproducible without ssh access. Sampled
anchors match the precomputed summary exactly:
  top 1% = 46.5%, top 5% = 66.5%, top 10% = 74.6%
plus newly readable points:
  top 25% = 87.5%, top 50% = 96.0%

Workload characterization is now consistent with the production
distribution rather than the small replay subset. Replay window CDF kept
as an overlay to show the same hockey-stick shape on the data §5 actually
uses.

- analysis/characterization/data/production_session_skew_cdf.json: cached
  sample points (29 KB), so the figure rebuilds locally
- scripts/plot_session_skew_cdf.py: now plots from the cache + replay raw
- MEETING.md / PAPER_OUTLINE.md: revert numbers to production trace,
  add top-25%/50% data points

Co-Authored-By: Claude Opus 4.7 <noreply@anthropic.com>
119 KiB
1178x759px
119 KiB
1178x759px