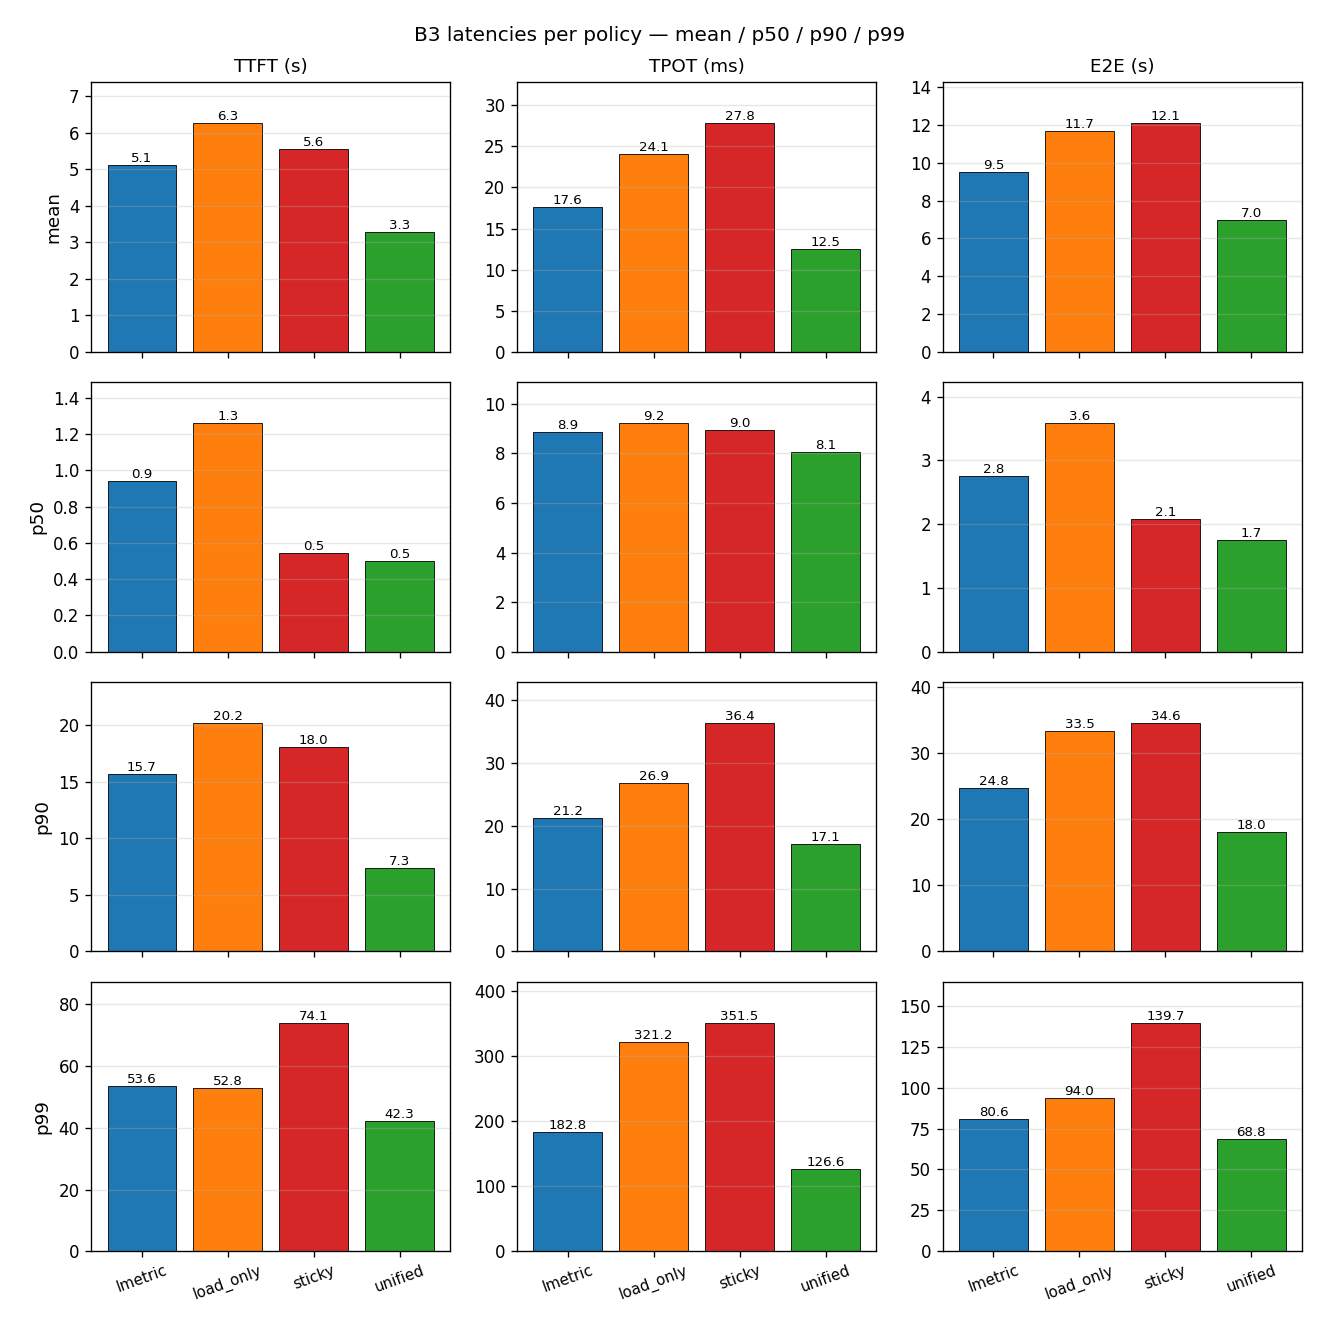
The headline f6_e2e_latency_bars only shows p90, hiding three regimes:
  - mean: unified dominates (3.3s TTFT, 7.0s E2E vs sticky 5.6s / 12.1s)
  - p50: sticky and unified are tied on first-turn TTFT (0.5s each) —
    sticky's first turn of each session is free, after which queues
    accumulate. Unified beats sticky everywhere else.
  - p99: tail amplification reveals unified's biggest gap —
    TTFT 42.3s vs sticky 74.1s; E2E 68.8s vs sticky 139.7s.

The 12-panel figure is the honest full picture; the 3-panel headline
stays for slide-friendly summary.

- analysis/characterization/window_1_results/raw_stats/{policy}.json:
  cached ttft/tpot/e2e {mean,p50,p90,p99} pulled from dash0
  /home/admin/cpfs/wjh/agentic-kv/outputs/b3_sweep_20260525_095043/
  (b3_policy_comparison.json doesn't record mean, only percentiles).
- analysis/characterization/render_window1_figures.py:
  new fig_b3_latency_full_grid renders the 4×3 grid from the cache.
- figs/f6_e2e_latency_full_grid.png: 12-panel companion.
- PAPER_OUTLINE.md §5.2: both figures embedded; main table column
  renamed from "Hotspot idx" to "Worker p90 (median / max)" to match
  the new metric convention.

Co-Authored-By: Claude Opus 4.7 <noreply@anthropic.com>
110 KiB
1320x1320px
110 KiB
1320x1320px