Adds a two-panel TTFT PDF comparison plot inserted as a new V2_DEEP_ANALYSIS
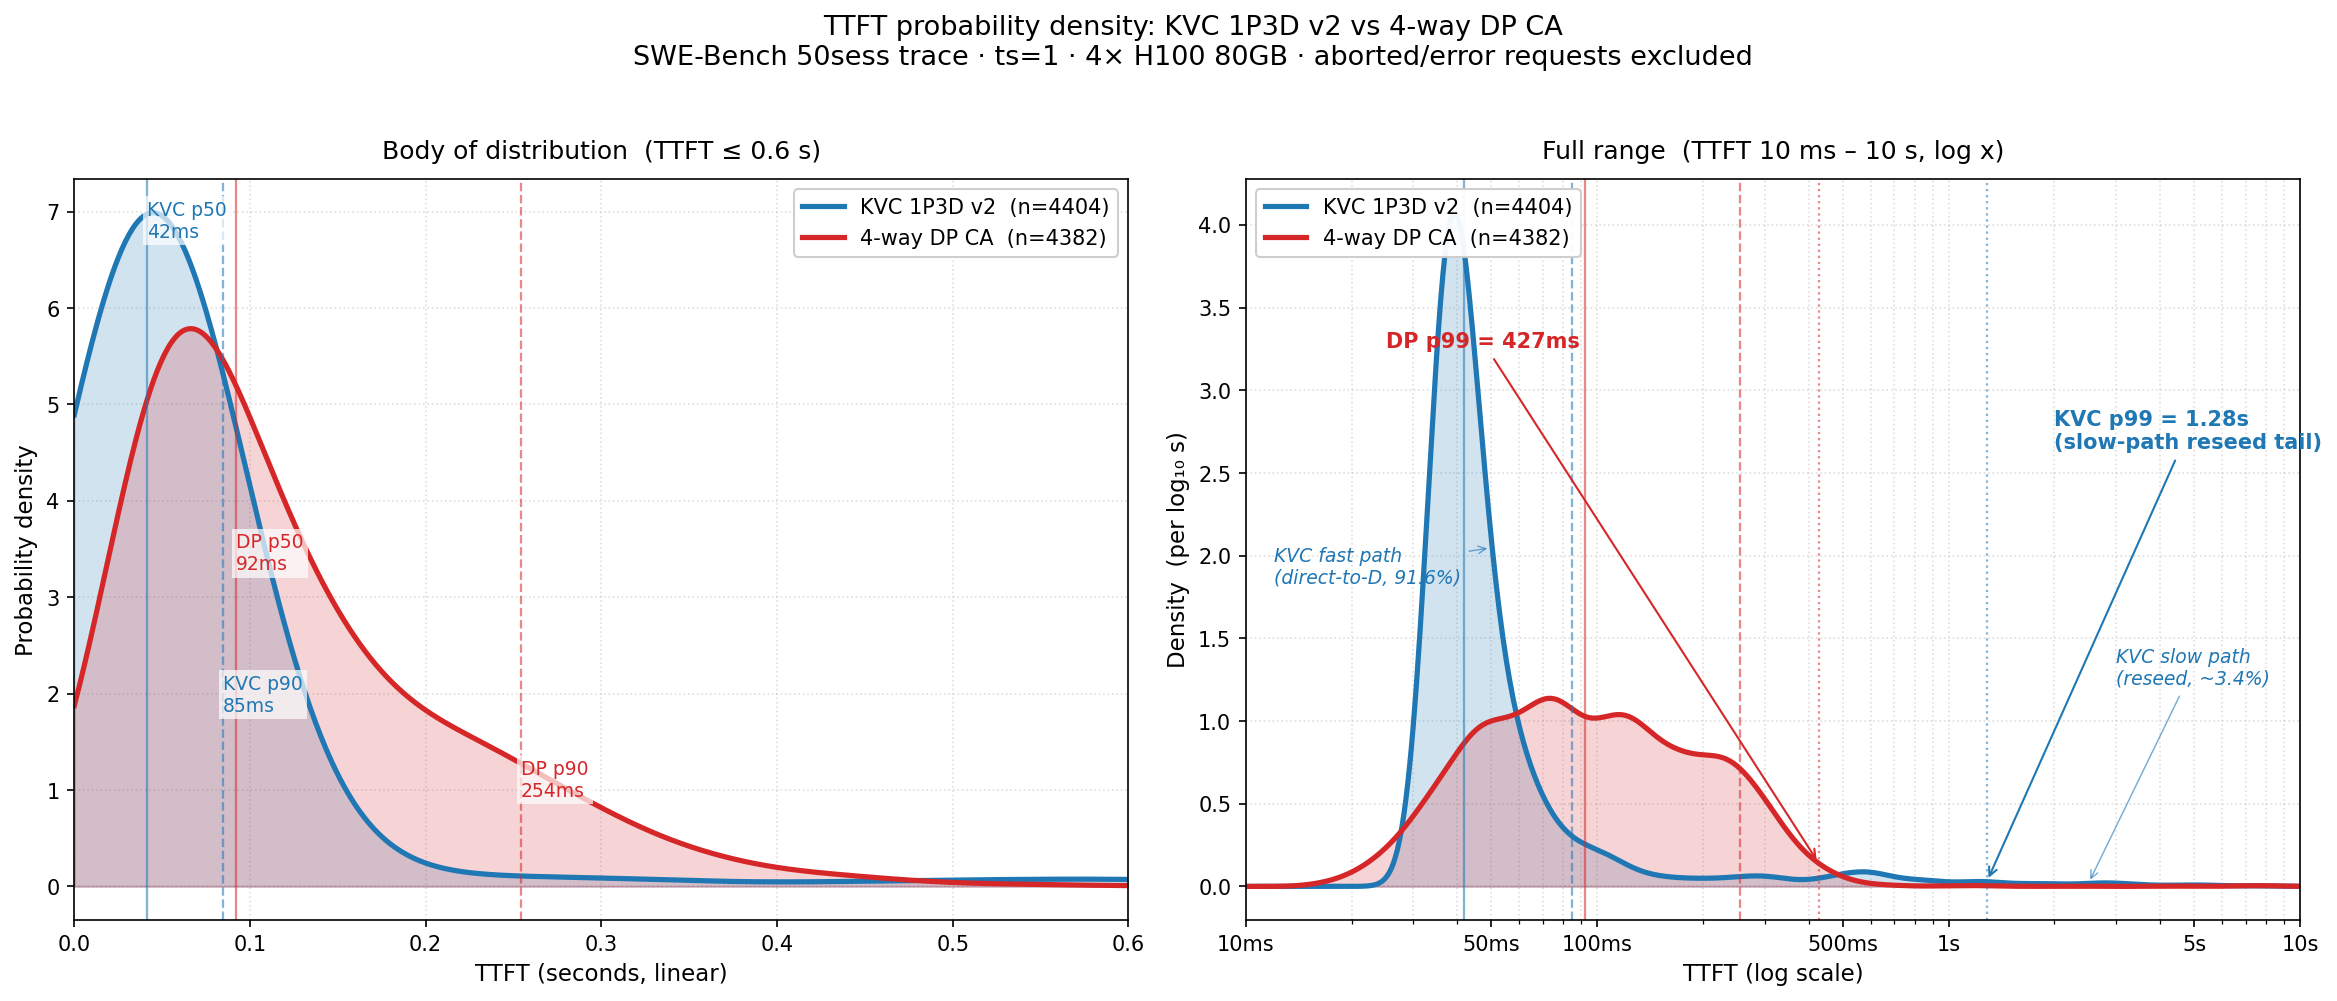
§3.4 ("TTFT 概率密度对比: bimodal vs unimodal"). Single-percentile numbers
(p50 / p99) hide the qualitative difference between the two distributions;
the figure makes it visible at a glance.
Left panel (linear x in [0, 0.6]s, body):
KVC has a sharp peak at ~40ms (the direct-to-D fast path).
DP has a broad peak around 50-200ms (full prefill per request).
Annotated with p50 and p90 markers for each side.
Right panel (log x in [10ms, 10s], full range):
KVC is visibly bimodal: a tall fast-path peak plus a small reseed tail
around 1-5s.
DP is unimodal: a single broad peak with shorter tail.
Annotated with p99 callouts pointing to each tail.
KDE: scipy.stats.gaussian_kde, bandwidth=0.15 for the body (Scott's rule
oversmooths the sharp fast-path peak), log10-transformed for the full-range
panel so the bimodal structure is visible.
Bundled:
- scripts/analysis/plot_ttft_pdf.py -- rerunable when v2 / DP data change.
Co-Authored-By: Claude Opus 4.7 (1M context) <noreply@anthropic.com>
315 KiB
2337x1001px
315 KiB
2337x1001px