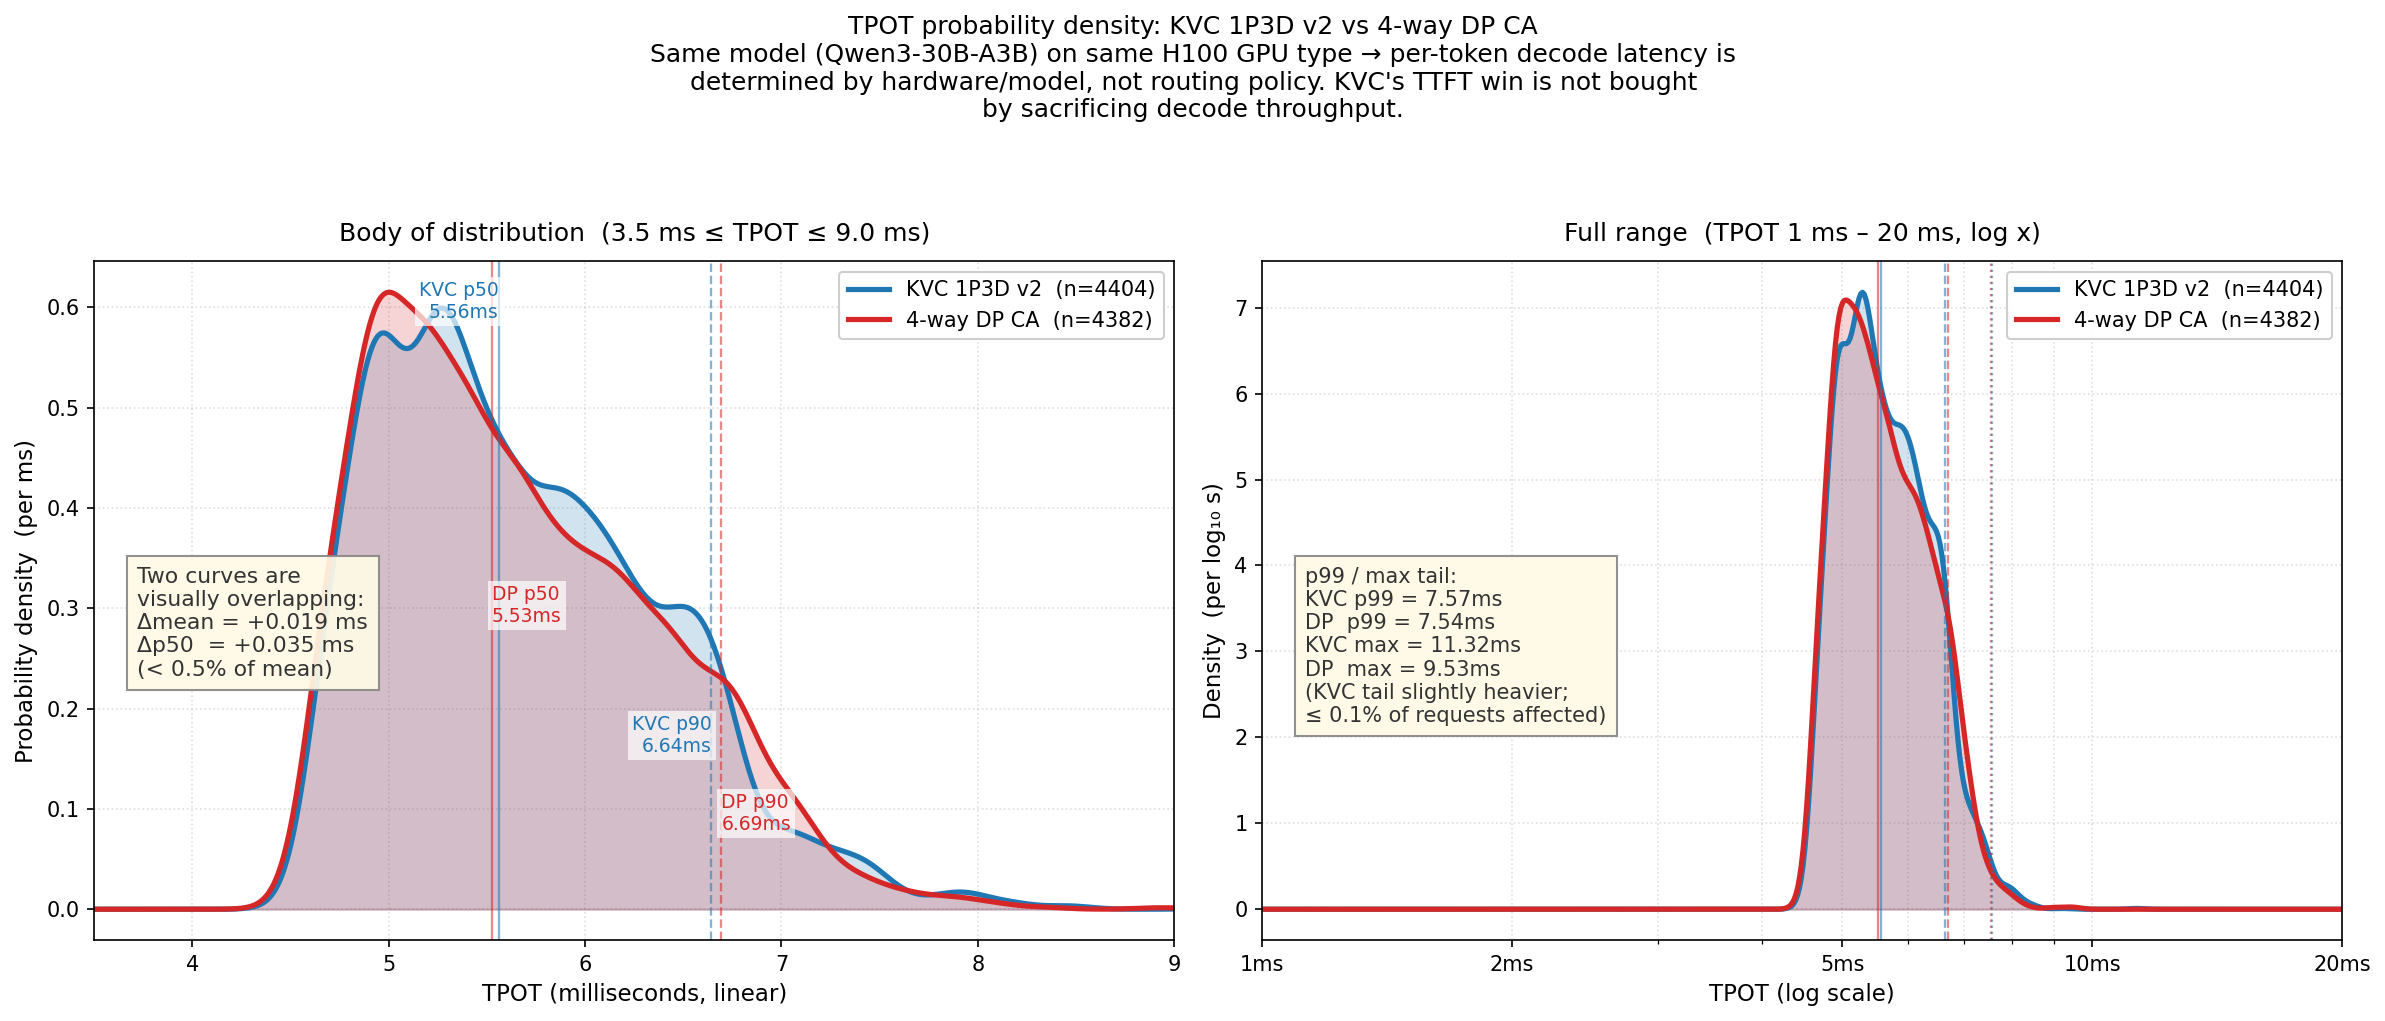
Mirrors the TTFT PDF figure style. Inserted into V2_DEEP_ANALYSIS as a
new §3.5 immediately following §3.4 (TTFT PDF).

The figure preempts a likely reviewer challenge: "Is KVC's TTFT win
bought by sacrificing decode throughput (TPOT)?". The empirical answer
is no -- two KDE curves overlap visually almost perfectly.

Measured TPOT deltas (KVC v2 vs DP 4w, n>=4382 each):
  mean: +0.019 ms  (+0.34%)
  p50:  +0.035 ms  (+0.63%)
  p90:  -0.050 ms  (-0.75%, slight KVC advantage)
  p99:  +0.026 ms  (+0.34%)

The only visible difference is in max-of-distribution:
  KVC max = 11.32 ms  vs  DP max = 9.53 ms
(plausibly cold-start jitter on the first decode step after a reseed;
affects <= 0.1% of requests)

Two-panel figure mirroring the TTFT PDF style:
  left  panel: linear x in [3.5, 9.0] ms -- body
  right panel: log x in [1, 20] ms -- full range with tail

Each panel annotates the percentile gaps with bbox callouts so the
reader's takeaway is "they overlap" not "is there a difference".

Paper purpose: cited from V2_DEEP_ANALYSIS §3.5 as the supporting
evidence that the path-level latency win in §3.2 is concentrated in
the TTFT segment, not in decode. This is what makes the win a real
end-to-end win, not a measurement artifact.

Co-Authored-By: Claude Opus 4.7 (1M context) <noreply@anthropic.com>
306 KiB
2385x1021px
306 KiB
2385x1021px