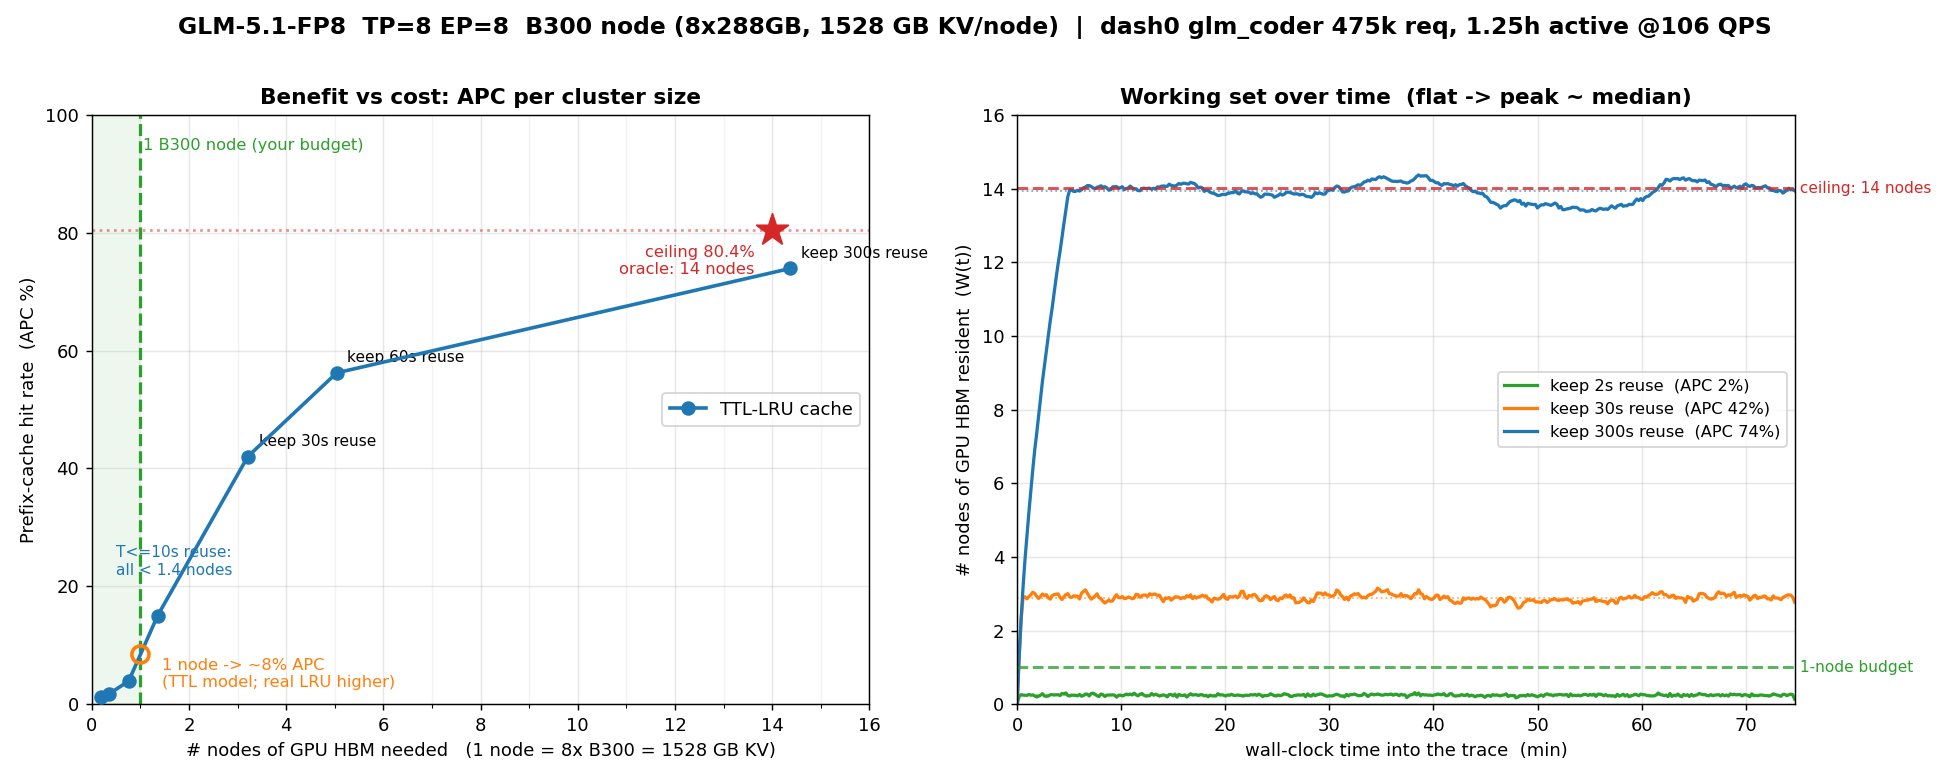
Replace the (redundant) nodes-vs-T cost curve with the working-set
W(t) over wall-clock time for T=2/30/300s. Shows footprint is steady
(peak ~ median) after a short warm-up, so peak-based sizing is sound;
the 300s curve hugs the 14-node ceiling throughout.

Co-Authored-By: Claude Opus 4.7 <noreply@anthropic.com>
190 KiB
1950x780px
190 KiB
1950x780px